My Twitterhood
I've been using Twitter for just about a year now (username: larsga), ever since Tim Bray wrote enough about it to make me curious about what it was. I've since come to enjoy it as a kind of mix between blogs and chat, and have developed a very mixed crowd of people that I follow. One day I started thinking about categorizing these people, and I started wondering what clusters of Twitterers I was really following.
I then realized that there was an easy way to try to get a picture of this. I could just bang something up in Python that would use the Twitter web API to build a little topic map of my immediate Twitter neighbourhood, and then view it in the Vizigator. Using python-twitter this was the work of minutes. Or nearly so. Since Twitter has a quite strict limit on the number of requests per user per hour the script actually took several hours to run.
The output of the script is a CTM file that contains a topic for each Twitter user and uses associations to represent follower relationships. It starts with one user (me, in my case, of course) and then lists all users followed by that user, and then in turn all the users they follow. The result looks like this:
%prefix tweep http://twitter.com/
%prefix t http://psi.garshol.priv.no/experimental/twitter/
tweep:larsga isa t:twitterer;
  - "larsga".
tweep:neilgodfrey isa t:twitterer;
  - "neilgodfrey".
t:is-following(t:follower: tweep:larsga, t:following: tweep:neilgodfrey)
t:is-following(t:follower: tweep:neilgodfrey, t:following: tweep:AcharyaS)
# all the people neilgodfrey follows
tweep:nahove isa t:twitterer;
  - "nahove".
t:is-following(t:follower: tweep:larsga, t:following: tweep:nahove)
# all the people nahove follows
# and so on
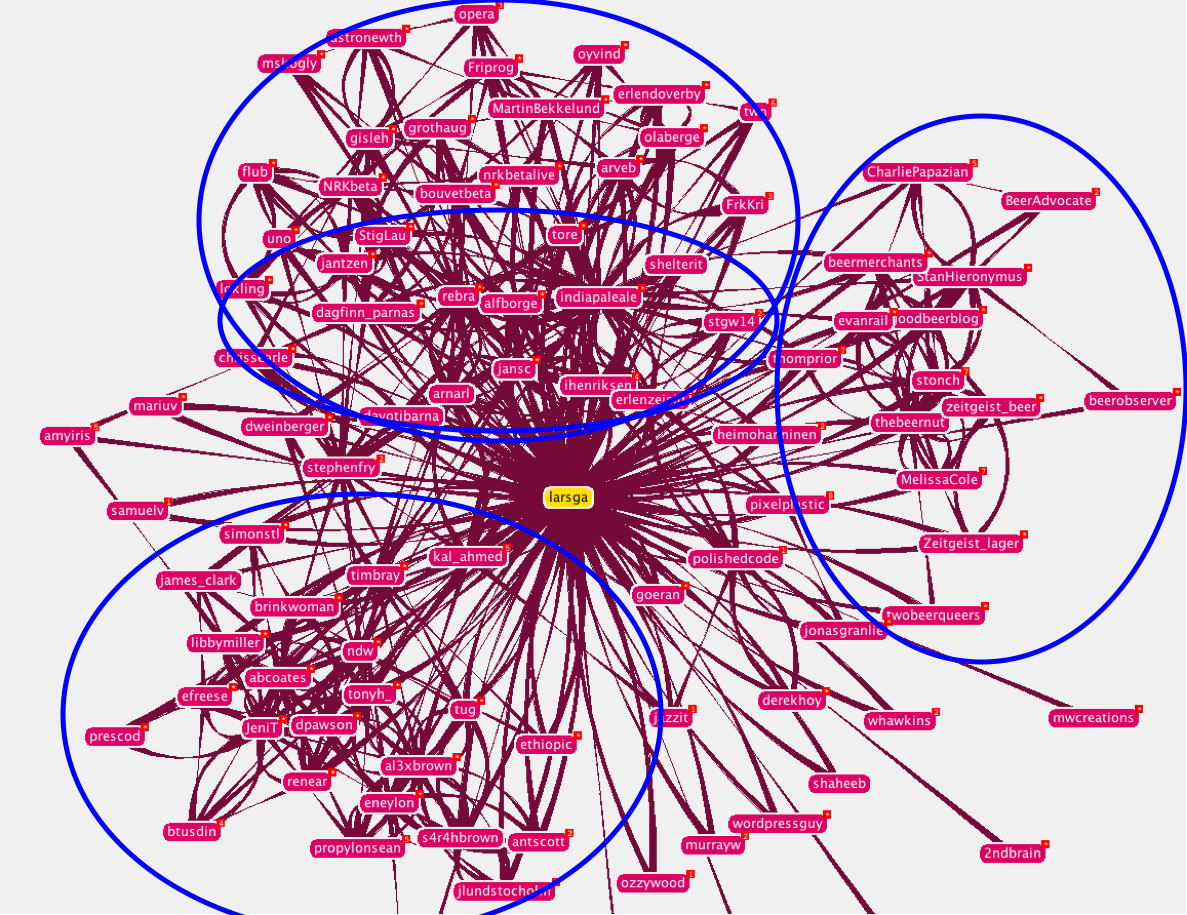
Viewing this in Vizigator and opening it on the topic that represents myself then actually does resolve the cloud of Twitterers into something meaningful, rather surprisingly:

The uppermost blue circle contains Norwegian IT people, with the smaller blue circle inside it has Norwegian Topic Mappers. The rest of the Topic Mappers are dispersed all over the cloud because, apparently, they don't follow each other. On the right is beer people, and on the lower left is XML people. The rest are unclassifiables and Topic Mappers. Quite a few of the latter seem to have gathered between the beer people and the XML people, but I couldn't seem to get them into a single circle.
If you want to try this out for yourself you can get the script, or the CTM file of the people I follow.
Similar posts
Playing with the Google Maps API
I sat down to try the Google Maps API yesterday, and came away very impressed by both it and the new AJAX style of web applications
Read | 2005-12-03 13:38
The web's identity crisis and httpRange-14
URIs are used to refer to both information resources (which are downloadable over the net) and abstract concepts and physical objects (which are not)
Read | 2007-10-08 08:54
A TMCL tutorial
The TMCL standard now seems more or less stable, and so now it is finally possible to explain to outsiders what the language looks like and how it works
Read | 2008-10-03 17:33
Comments
Steve Pepper - 2009-04-23 09:21:21
Cool. Nice example of how this visualization stuff can have a use after all - not for navigation, but for discovering patterns you might not otherwise have noticed.
Benjamin Bock - 2009-04-30 13:05:01
Just found by accident that others are doing similar things: http://twitnest.appspot.com/
It ignores the asymmetry, though. The latter was analyzed in this interesting article, btw: http://bokardo.com/archives/relationship-symmetry-in-social-networks-why-facebook-will-go-fully-asymmetric/
I did that with german studivz a while ago, but it's getting more and more complicated due to harder-to-crack captchas.
Frank - 2009-05-23 18:54:21
Starting follow you - no problem. The Vizigator cloud is impressing - but to much for my account.
Oliver - 2009-07-10 05:23:08
exremely cool. i have no idea about phyton but ill try to get my head around this. cant you make a web-app for this?
Andreas - 2009-07-30 09:47:14
That Cloud is impressing. Are the distances metrically calculated or is it just optically designed to display the three different cloud-Parts? Maybe it would be nice to reorganize the display with support of the statistical method of multidimensional scaling.
Gry Dla Dzieci - 2009-08-10 03:01:16
Very nice visualization of your neighborhood. Twitter is a powerful tool for anyone who want to increase popularity and site's traffic. I don't know how will social networking sites look in future but I'm sure that Twitter is just the beginning of real websites revolution. Really. It is just something new. Different from Facebook and other social sites. It is not only about presenting a profile but about advertising, following, blogging. It is an essence of web 2.0 and I'm pretty sure Twitter soon will overtake Facebook.