Impressions from Strata London 2013
Noel Welsh on bandit algorithms |
The first thing that struck me about the conference was that it had to be a fairly new conference. Speakers and attendees didn't really seem to know one another from before. The program was a bit of an odd mix, just like the attendees. And so on. It was still a very interesting conference, however, and the presentations of unusually high quality, so I very much recommend it.
The audience was highly motivated and knowledgeable, which made the conference even more interesting. One of the speakers ended his talk early at 24 minutes, leaving 16 minutes of his slot, which made me feel rather cheated. However, the audience easily filled the time with relevant and clued-in questions, and he answered them well, so the time was in fact well spent. And this was typical. Most talks would be followed by a number of interesting and relevant questions.
My goal for the conference was to evaluate the state of the Big Data scene in general, get ideas for new ways to use Big Data analysis, and learn new Big Data analysis techniques. Below follows my summary of the talks I found the most interesting.
Airbnb
They let people sell accomodation in private homes, basically, and the talk was about how they use A/B testing to improve their user interface. The idea is that you have two variants of the interface (A and B), and each user randomly gets one of the two. You then measure which of the two works best (generates the most sales or whatever your metric is). If you're interested in the subject I recommend the slides, as it was a very clear presentation of the technique.
My main takeaways from it were that most user interface changes made no measurable difference. That is, the test might say that A or B was better by some percentage, but the statistical significance (the p-value) would be too low for it to be believable. So don't try to do this without checking the significance!
The speaker, Jan Overgoor, was asked what they did if a test turned out to be costly. That is, if one of the alternatives did poorly than the other the test would be costing them money. If it did much more poorly the test would cost even more. The speaker said that they considered it a cost well spent as improvements would stay with the site for a long time, while the test would last only a month or so. That is, essentially they did nothing to mitigate the cost, which is interesting in light of what followed.

At the Elgin, 20 minutes from Strata |
Crossrail
The Crossrail project is the biggest civil engineering project in Europe at the moment, building rail tunnels and huge railway stations underground in central London. Now, when you build a tunnel, there's a tendency for the surface above it to sink somewhat. When said surface is the most expensive real estate on earth, littered with Victorian sewage tunnels, skyscrapers, tube tunnels and who knows what else, this becomes a rather pressing concern.
To solve the problem Crossrail has put out hundreds of thousands of sensors that measure ground movement up and down. The readings from these are stored in a huge database, and each morning at 0730 22 teams of engineers would meet to pore over 350-page PDF documents produced from this database to look for problems. This was labour-intensive, error-prone, stressful, and limited in scope, since the engineers would only look at the areas where work was actually going on. In practice, however, sinking can occur a good distance off and at a substantially later time.
Enter QuantumBlack, a Big Data analytics vendor. Using historical data and knowledge of the spatial relationships between sensors they built a model that could predict sinkages for all sensors 10-15 days into the future with max deviation from prediction of well below 1 mm. They also built a web interface showing readings and warnings graphically on a map, which suddenly made following up readings a completely different proposition.
Not only that, but they were able to predict how many meters (and how frequent manual readings) they would need in order to keep their predictions within 1mm, 2mm, 3mm etc. The numbers showed clearly that the number of meters could be reduced significantly, and the number of manual readings likewise. The consequent savings should be obvious.
In fact, the total project cost is estimated at 16 billion GBP, which is hardly pocket change, and a significant fraction of that is devoted to monitoring ground movement. My immediate conclusion was that if QuantumBlack could do half of what the presentation promised QuantumBlack stock is going to be a very good investment indeed.
The only downside of the presentation was that they considered their algorithms a trade secret, so that very little information was forthcoming on how they did this. I got a little bit from their Chief Scientist after the presentation, but not enough to be able to say anything meaningful about how this was done. Sorry.

Looking across to Hong Kong island, north side |
Hong Kong
In the last part of the presentation the speaker mentioned that they were in negotiations with other cities, such as for example Hong Kong. Which didn't surprise me at all, because my father is currently busy building a sewage tunnel underneath the north side of Hong Kong island. That's harder than it sounds, because that strip is one of the densest concentrations of skyscrapers on earth, most of them built on unstable land reclaimed from the sea. Here, too, property prices are among the highest on earth, and again ground movements are a major concern.
In fact, phase one of the tunnel project 10 years ago ran into serious difficulties with ground sinking. They had tunnel collapses, and ground sinkage of up to half a meter two kilometers away from the tunnel, causing major delays and cost overruns on the project. Today, phase two is almost completed, with no major problems, using a system not totally unlike that of Crossrail. Basically, they too have a database, and there are preset warning levels, and so on, but they are static and much less sophisticated than those used by Crossrail.
My father's reaction was that their project was almost done, so it was too late for them, but this would definitely be interesting for future Hong Kong tunnels, of which many are planned. (Oh, and if you want to know how phase two avoided problems, see the paper Excavation of Dry Subsea Rock Tunnels in Hong Kong using Micro-Fine Cement and Colloidal Silica for Groundwater Control; Garshol, Tam, Chau and Lau; Proceedings of the World Tunnel Congress 2014. For a very vivid explanation of how this is done, and what happens if you do it the wrong way, check these slides.)
ETL at LinkedIn
Rajappa Iyer did a presentation on how LinkedIn handles data flows, of which they have quite a lot. In fact, he said that at any given time there would be around 1000 ETL jobs running at LinkedIn, which gives you an idea of the scale. The main thing they'd done differently was to extract information about the jobs, and then use that to monitor and run them.
Basically, they keep track of which flows depend on which other flows, which flows must be completed before other flows can start, what types of entities go into and come out of flows, etc. They also do a lot around tracking errors and deciding what errors to pay attention to, and who should be notified etc.
According to Iyer they intend to open source the framework next year, once they've managed to clean out the LinkedIn-specific code. I really recommend the slides, which give a very clear (and interesting!) picture of LinkedIn's data products and their ecosystem. There's a lot of Hadoop in there, but according to Iyer they also use Informatica ETL and other more conventional tools.

Reflections |
Bayesian statistics
I've been a fan of Bayes's theorem for a long time, having already used it to recommend news and detect duplicate database records. Jurgen van Gael gave a very clear presentation of what the theorem actually means, and how it can be used. The usual examples are quite startling: how you can detect whether a coin is biased, and how you can work out what a positive sample on a medical test on a certain accuracy means. Perhaps most startling at all is that the actual computations involved are simple high school maths.
Then, however, he went a good deal beyond that, showing how Bayesian reasoning can be used for numerical computations of kinds that you wouldn't believe possible. He showed an example of using PyMC to specify the problem of working out from sales data whether or not the sales rate was going up or down. Eyeballing the data it looked to me like it might possibly have gone up, and that variance had certainly gone up.
He showed how you can basically just specify the problem as one of three variables: sales rate period 1, sales rate period 2, and the switchover point between the periods. PyMC then computes the rest, and comes up with probability distributions for each of the values. So not only can you see the most likely values, you can also see how confident they are. The answer was: yes, sales rate had gone up, and so had variation (visible in that the probability distribution for period 2 was wider).
The main downside to this approach is that it does require you to have a fair understanding of statistics. For example, it's not obvious that the sales rates should be treated as Poisson distributions. There is work on creating probabilistic programming languages, like Church, but I doubt these require you to know any less statistics.
Recommendations with missing data
Another very interesting presentation was Ulrich Rueckert's about recommendations with limited data. Basically, it's a common problem when doing recommendations that each user only has opinions on a small fraction of the products, and they only bother to rate a small fraction of that again. So the data is always really sparse. The talk was about how you could use data that exists, but lacks the actual rating, to fill out the rating data and improve results.
Interestingly, once we got on to the actual maths it was clear that in a mathematical sense this was not a recommendation problem, but a classification problem. Classification is basically when you for each input object produce a label from a closed set. The closed set can be spam/not spam, values from a taxonomy, or would like/would not like, and so on.
This is typical of Big Data analytics, by the way. The techniques are formulated in maths, and seeing how you can apply them often requires considerable thinking. The same technique can often be reused, perhaps with minor modifications, for a wide range of problems That is, the problems can be very different in a business or conceptual sense, but often the underlying mathemathics can be the same.
I won't try to reproduce the talk here, because you really need the graphs to make any sense of it, and the slides are very clear. I really recommend taking the time to go through the slides. Knowing a little of the jargon helps a lot.

Ice forming on surface of lake |
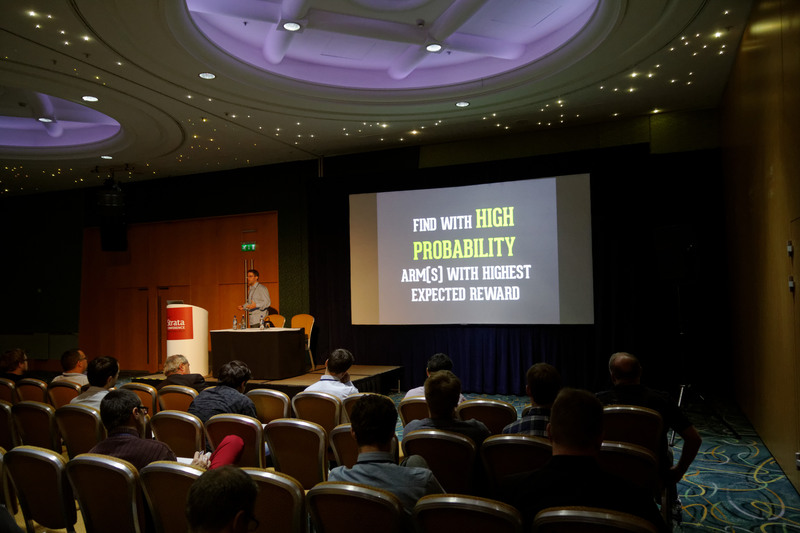
Bandit algorithms
One of the most interesting talks was this one, by Noel Welsh, who's also started an online book on the subject of bandit algorithms. To see what a bandit algorithm is, imagine that you're in front of a whole bunch of one-armed bandits. Their payback rates are different, but the only thing you can do is put money in the slots, pull the arms, and observe the payback. The purpose of the algorithm is to maximize your payback, or, equivalently, minimize the loss of potential payback through spending coins on the wrong machines.
Think back to the A/B testing. The A and B user interface alternatives are metaphorically one-armed bandits, and by presenting the user for one of them you're essentially pulling the arm. You win if the user buys something, and you lose (not a coin, but the possible sale) if the user does not.
Here is the answer to the question Jan Overgoor was asked. Bandit algorithms provide an optimal solution to the tradeoff between exploring unproven user interface alternatives and playing it safe by always reusing the alternative that's done best so far. The algorithm called Thompson Sampling provides provably the best alternative, and has fairly tight bounds on the possible loss you can face.
The talk hinted further about how these algorithms could be applied in cases where you have a context, such as for recommendations or news filtering. In fact these algorithms seem to have fairly wide application, and to be conceptually somewhat related to Bayes Theorem. This is one area I'm intend to explore more, because these algorithms seem both powerful and simple.
My takeaways
So what did I take away from the conference, apart from the observations at the beginning? For one thing, that Big Data analysis is not about tools and products, but about maths. You have to understand, at least to some degree, the underlying maths. If you do, implementing what you want to solve, with NumPy, PyMC, or whatever, is in many cases not that hard. (If you have huge amounts of data you might still be in the market for something that makes Hadoop easier.)
A number of speakers also repeated that Big Data is not really about Big Data, but about Data Science. That is, doing analysis of data to answer business-critical questions. One speaker even called it Little Data, which I personally think is a term that will most likely confuse people, but in context he did get the point across. I think this is a key point to emphasize, because many customers dismiss Big Data as irrelevant for them, since they don't have really big data sets.
I learned a few new tricks, which is useful, and got a better impression of where the Big Data world is. As I said, it's clearly still early days. There were very few use cases and success stories, with Crossrail being almost the only one that I saw, unless you want to count LinkedIn, whose data is their product.
I still very much believe in Big Data analytics, because what the conference underlined once again is that this really has the ability to impact companies's bottom line directly. Anything that can reduce your costs by a few percent, or increase income by a few percent, is very, very valuable. And Big Data clearly has the potential to do that, and in some cases quite a lot more. But you really do need the maths.
Similar posts
How Big Data will change IT
One of the changes that Big Data is going to bring to the IT world is a new emphasis on information
Read | 2013-10-03 19:00
Thoughts on Big Data
Big Data has really caught on as a buzz word, even well outside the technology world, with journalists writing columns on its consequences for privacy, research, and so on
Read | 2013-09-11 15:06
Durian, King of Fruits
We were visiting my father, who lives in Hong Kong, and went shopping for food in a shopping mall in Hang Hau
Read | 2013-02-24 20:52
Comments
Aad Kamsteeg - 2013-11-23 02:23:29
Hi Lars, Nice read! Sounds like a real good conference... I've listed it now. I find that one of the last paragraphs of your concluding is key in the whole 'big' field:
"A number of speakers also repeated that Big Data is not really about Big Data, but about Data Science. That is, doing analysis of data to answer business-critical questions. One speaker even called it Little Data, which I personally think is a term that will most likely confuse people, but in context he did get the point across. I think this is a key point to emphasize, because many customers dismiss Big Data as irrelevant for them, since they don't have really big data sets."
Getting the big trick is to get the big out of the way.
Lars Marius - 2013-11-23 05:30:33
Hi there, Aad,
Maybe I'll see you in Barcelona next year, then. :)
I totally agree that size is not what matters, and that this is the key to getting value out of the whole thing. It's really Data Science that matters, not having terabytes of data.